How AI Forecasts Demand: The Mechanics and Real Business Impact
AI demand forecasting works by training machine learning models on historical sales data, then identifying patterns — trends, seasonality, day-of-week effects, promotional impact, and correlations with external factors — that a model uses to predict future demand.
Unlike traditional forecasting, which applies a fixed formula to past averages, AI models continuously update their predictions as new data arrives, making them far more responsive to real shifts in customer behavior.
The business impact shows up as fewer stockouts, less excess inventory, and tighter alignment between purchasing and actual demand — but only when the model is fed clean, sufficient data and its outputs are sanity-checked against real-world context.
Start With What “Forecasting Demand” Actually Means
Before getting into how AI does this, it’s worth being precise about the problem.
Demand forecasting is the attempt to answer one question:
How many units of this item will sell, in this location, in this time window?
Every business that holds inventory is implicitly answering this question already — most just answer it badly, using last month’s sales number and a gut feeling about whether things are trending up or down.
AI doesn’t change the question. It changes how rigorously and how frequently the answer gets recalculated.
How AI Actually Learns to Forecast Demand
Step 1: It Starts With Historical Data, But More of It Than Humans Typically Use
A traditional forecast might look at the last 3 months of sales for a SKU.
AI models can ingest years of historical sales data simultaneously, across thousands of SKUs and locations at once, finding patterns no human analyst has time to manually spot — like a specific product that sells unusually well in the 3 days following payday, a pattern invisible in a simple month-over-month average.
Step 2: It Identifies Multiple, Overlapping Patterns at Once
Real demand is rarely driven by one factor.
A model trained properly will separate out:
- Trend — is overall demand for this item growing or shrinking over time?
- Seasonality — recurring patterns tied to time of year, day of week, or even time of day.
- Promotional lift — how much a discount or marketing push actually moved units, isolated from the underlying trend.
- Cross-product effects — how the demand for one item correlates with another (a spike in burger patty sales predicting a corresponding spike in bun sales).
- External signals — weather, local events, economic indicators, or social media trends, when relevant and available.
Traditional forecasting methods can attempt some of this manually, but separating overlapping effects accurately, across thousands of products, is exactly the kind of pattern-recognition task machine learning is suited for.
Illustration:
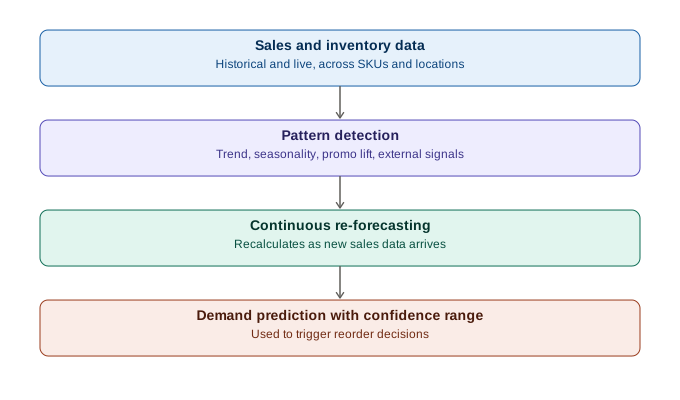
How AI forecasts demand: a flowchart showing sales data flowing into pattern detection, continuous re-forecasting, and a demand prediction with a confidence range.
How AI forecasting works end to end: raw sales data is continuously reprocessed into an actionable, confidence-rated prediction.
Step 3: It Continuously Re-Forecasts as New Data Arrives
This is the most practically important difference.
A traditional quarterly forecast is a snapshot — accurate the day it’s made, stale a few weeks later.
AI-driven forecasting recalculates as new sales data flows in, meaning the system notices a demand shift within days, not at the next quarterly review.
Step 4: It Outputs a Probability Range, Not Just a Single Number
Good AI forecasting doesn’t claim to know exactly how many units will sell — it gives a predicted range with confidence levels (“likely between 420–480 units, 90% confidence”), which matters enormously for how a business should actually act on the number.
A wide uncertainty range on a new product should trigger more conservative ordering than a narrow range on an established, stable seller.
A Real Business Scenario: Watching This Play Out
Consider a mid-sized apparel retailer selling both online and through physical stores.
Heading into a seasonal transition — say, moving from summer to fall inventory — the buying team historically relied on the previous year’s sales as their baseline, adjusted up or down based on a general sense of how the current season was trending.
The Traditional Approach Problem
Last year’s fall season had unusually warm weather early on, delaying the seasonal sales spike for sweaters and jackets by roughly three weeks.
The buying team’s spreadsheet-based forecast, built on that single prior year, assumed the same delayed pattern would repeat — but this year’s weather turned cold early.
By the time the team noticed actual sales weren’t matching the forecast, the company was three weeks behind on reordering its best-selling jacket, missing a meaningful stretch of peak-demand sales on a high-margin category.
Where an AI-Driven Forecast Changes the Outcome
An AI model trained on multiple years of sales data, rather than just the prior year, would recognize that the “delayed fall spike” was a weather-driven anomaly, not a structural seasonal pattern.
Combined with current-season weather data as an input signal, the model would detect the early cold snap and the resulting early sales uptick within the first few days, triggering a reorder recommendation while the team’s spreadsheet-based process was still anchored to last year’s timeline.
The practical effect isn’t a dramatic transformation — it’s the difference between catching a demand shift in days instead of weeks, which for a seasonal category with a short selling window translates directly into captured revenue that the slower process would have missed.
This is the pattern worth internalizing:
AI’s advantage in forecasting isn’t that it’s smarter than an experienced buyer’s instinct — it’s that it notices shifts faster and across more variables simultaneously than a manual process realistically can.
Illustration:
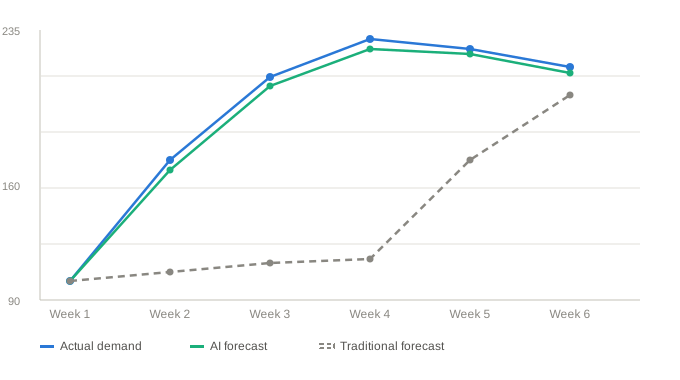
Line chart comparing actual demand, AI forecast, and traditional forecast over six weeks, showing the AI forecast tracking the real demand spike within days while the traditional forecast lags three weeks.
The AI forecast tracks the real demand spike almost immediately. The traditional forecast doesn’t catch up until week 5 — by which point three weeks of peak-season sales have already been missed.
Where This Breaks Down in Practice
Being direct about the limits matters here, since this is where a lot of AI forecasting projects quietly underdeliver:
- New products have no history to learn from. A brand-new SKU forces the model to rely on analogous products or category-level patterns, which is inherently less reliable than forecasting an established seller.
- Truly novel disruptions confuse the model. A sudden supply shock, a viral social moment, or an unprecedented event has, by definition, no precedent in the training data — human judgment is still essential in these moments, not optional.
- Thin or inconsistent data produces false confidence. A model can output a precise-looking number from sparse or messy data, and that precision can be mistaken for accuracy. A forecast of “247 units” sounds more trustworthy than it should if it’s built on six months of inconsistent stock records.
- Forecasts can become a self-fulfilling loop if unchecked. If a model under-forecasts a product, leading to lower stock, leading to lower sales (because customers can’t find it on the shelf), leading the model to “confirm” its own low forecast — the business needs a human periodically checking for this kind of feedback distortion.
What This Means for How a Business Should Actually Use AI Forecasting
- Treat the forecast as a strong starting point, not a final answer — especially for new products, novel events, or thin sales history.
- Feed the model more than just internal sales data where possible — weather, local events, and promotional calendars meaningfully improve accuracy for businesses where those factors matter.
- Watch the confidence range, not just the central number — a wide uncertainty band is itself useful information, signaling where a human should apply more judgment before committing to a purchase order.
- Re-check the model’s assumptions periodically — especially after any major shift in the business, like a new sales channel, a new region, or a meaningfully different product mix than the historical data reflects.
- Keep data hygiene as the actual priority — consistent SKU naming, accurate stock counts, and clean sales history will improve forecasting accuracy more than switching to a more sophisticated model on top of messy data.
Frequently Asked Questions
Traditional methods typically apply a fixed formula to historical averages and update infrequently. AI models can identify multiple overlapping patterns simultaneously and recalculate continuously as new data arrives, making them far more responsive to real shifts in demand.
Generally at least 12–24 months is recommended to capture seasonal patterns reliably, though the model can still provide directional guidance with less, particularly for fast-moving products with frequent sales data.
Only indirectly, by drawing on patterns from similar existing products or category-level trends. New-product forecasts are inherently less reliable and should be treated with more caution than forecasts for established sellers.
Poor underlying data quality — inconsistent SKU records, irregular stock counts, or insufficient sales history — far more often than the sophistication of the model itself.